Plastics MFA
Design
The figure below presents a diagram of the plastics MFA. It covers the whole life-cycle of plastics from virgin production to end-of-life with different levels of recycling: recycling of polymers via mechanical recycling, recycling of monomers via chemical recycling, and utilization of captured emissions from incineration. The MFA is built as a succession of processes (or plastics stocks) connected by flows of polymers, either raw, embedded in goods, or in waste. They are listed in detail further below. What happens in each process to each flow is driven by exogenous parameters such as product lifetimes and waste collection rates that are provided as input data. Historic plastics consumption and trade flows are also provided as input data and serve for extrapolating future plastics stocks and trades. All exogenous parameter are also listed in detail further below.
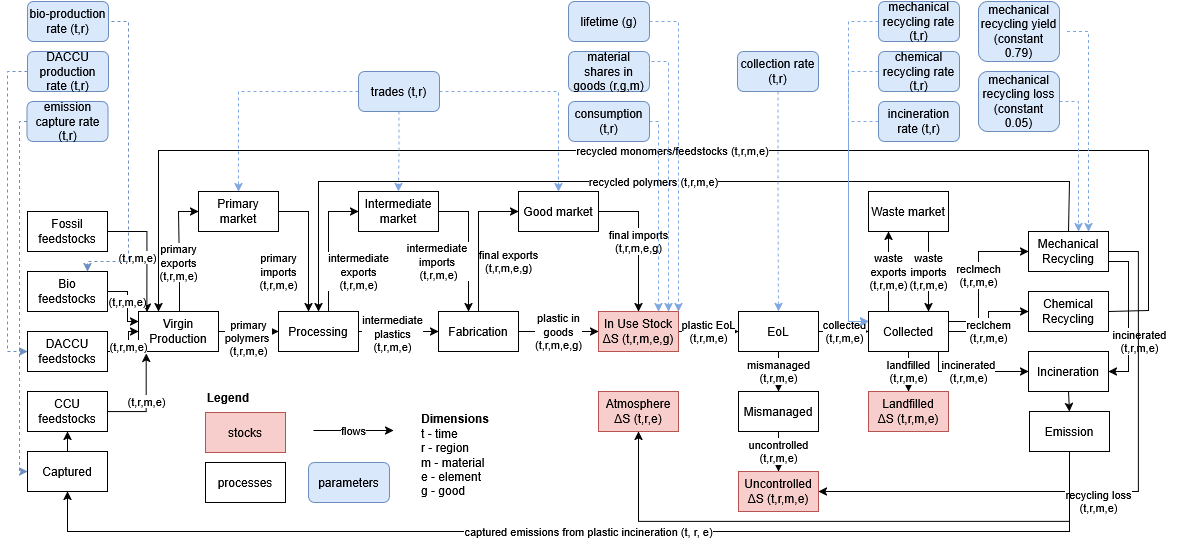 Figure 1: Diagram of the plastics MFA
Processes
The following table lists the processes that are modelled in the plastics MFA.
| Name |
|---|
| System environment |
| Feedstock(fossil) |
| Feedstock(biomass) |
| Feedstock(daccu) |
| Feedstock(ccu) |
| Virgin Production |
| Processing |
| Fabrication |
| Primary Market |
| Intermediate Market |
| Waste Market |
| Good Market |
| Mechanical Recycling |
| Chemical Recycling |
| Use Phase |
| EoL |
| Incineration |
| Landfilled |
| Collected |
| Uncollected |
| Uncontrolled |
| Emissions |
| Captured |
| Atmosphere |
Dimensions
The following table presents the dimensions over which parameters and variables (stocks and flows incl. trades) are defined in the plastics MFA.
| Name | Letter |
|---|---|
| Time | t |
| Historic Time | h |
| Element | e |
| Region | r |
| Material | m |
| Good | g |
Stocks
The following table presents the processes that are modelled as stocks in the plastics MFA with their respective dimensions and the lifetime model that is employed. We use an auxiliary stock for the stock extrapolation with only the dimensions that are regressed separately (r, g) to save dimensions and computation time. The auxiliary stock is computed using a dynamic stock model. The results are then transferred to the higher-dimensional in-use-stock in the MFA system by multiplying stock, inflow and outflow with the parameters "material shares in goods" and "carbon content materials". This stock is modelled as a simple flow driven stock.
| Dimensions | Name | Process | Stock Type | Lifetime Model |
|---|---|---|---|---|
| t, r, g | in_use_dsm | StockDrivenDSM | LogNormalLifetime | |
| t, e, r, m, g | in_use | Use Phase | SimpleFlowDrivenStock | |
| t, e, r | atmospheric | Atmosphere | SimpleFlowDrivenStock | |
| t, e, r, m | Landfilled | Landfilled | SimpleFlowDrivenStock | |
| t, e, r, m | Uncontrolled | Uncontrolled | SimpleFlowDrivenStock |
Stock extrapolation
For plastics stock extrapolation, the general method as described in the Model overview was slightly adjusted: plastics stock per capita regressions over GDP per capita did not align well for different regions, as regions with lower GDP per capita currently have higher stocks per capita than more developed regions had at the same GDP per capita in the past. This was attributed to the fact that plastics is a rather novel material compared to steel and cement, and historic stocks of developed regions are therefore not representative for today's stocks in developing regions. To account for this effect, a weighted sum of logGDP per capita and time was used as a predictor in stock extrapolation according to the formula: 'log10(gdppc) * weight + time'. The weight (documented in the assumptions below) was determined from a regression of time vs. log10(gdppc) at constant stock per capita (that is not part of the repository). Regression parameters for the stock extrapolation are derived in two steps: As a first step, in-use stocks are regressed per product category with common parameter sets for all regions. An upper bound to the saturation levels is set at the current maximum historic stock per capita for each product category over all regions. From this regression, the fitted global saturation level for each product category is used for a second regression: In-use stocks are now regressed separately per product category and region using the fitted global saturation level from the previous regression as upper bound with the exception of those regions which already exceed that stock level, where the maximum historic stock per capita in the respective region was used as upper bound. Hence, in-use stocks are extrapolated by using separate parameter sets for each region and product category. The extrapolated in-use stocks for all product categories then add up to the total in-use stock of a region.
Flows
The following table presents all flows in the plastics MFA with their respective dimensions and the processes that they connect.
| Dimensions | Origin Process | Destination Process |
|---|---|---|
| t, e, r, m | System environment | Feedstock(fossil) |
| t, e, r, m | System environment | Feedstock(biomass) |
| t, e, r, m | System environment | Feedstock(daccu) |
| t, e, r, m | System environment | Feedstock(ccu) |
| t, e, r | Atmosphere | Feedstock(biomass) |
| t, e, r | Atmosphere | Feedstock(daccu) |
| t, e, r, m | Feedstock(fossil) | Virgin Production |
| t, e, r, m | Feedstock(biomass) | Virgin Production |
| t, e, r, m | Feedstock(daccu) | Virgin Production |
| t, e, r, m | Feedstock(ccu) | Virgin Production |
| t, e, r, m | Virgin Production | Processing |
| t, e, r, m | Virgin Production | Primary Market |
| t, e, r, m | Primary Market | Processing |
| t, e, r, m | Primary Market | System environment |
| t, e, r, m | System environment | Primary Market |
| t, e, r, m | Processing | Fabrication |
| t, e, r, m | Processing | Intermediate Market |
| t, e, r, m | Intermediate Market | Fabrication |
| t, e, r, m | Intermediate Market | System environment |
| t, e, r, m | System environment | Intermediate Market |
| t, e, r, m, g | Fabrication | Good Market |
| t, e, r, m, g | Good Market | Use Phase |
| t, e, r, m, g | Fabrication | Use Phase |
| t, e, r, m | Good Market | System environment |
| t, e, r, m | System environment | Good Market |
| t, e, r, m, g | Use Phase | EoL |
| t, e, r, m | EoL | Collected |
| t, e, r, m | EoL | Uncollected |
| t, e, r, m | Collected | Mechanical Recycling |
| t, e, r, m | Collected | Chemical Recycling |
| t, e, r, m | Collected | Landfilled |
| t, e, r, m | Collected | Incineration |
| t, e, r, m | Uncollected | Uncontrolled |
| t, e, r, m | Mechanical Recycling | Processing |
| t, e, r, m | Chemical Recycling | Virgin Production |
| t, e, r, m | Mechanical Recycling | Uncontrolled |
| t, e, r, m | Mechanical Recycling | Incineration |
| t, e, r | Incineration | Emissions |
| t, e, r | Emissions | Captured |
| t, e, r | Emissions | Atmosphere |
| t, e, r | Captured | Feedstock(ccu) |
| t, r | System environment | Good Market |
| t, e, r, m | Waste Market | Collected |
| t, e, r, m | Collected | Waste Market |
| t, e, r, m | Waste Market | System environment |
| t, e, r, m | System environment | Waste Market |
Flows that enter or leave markets are the exports and imports of the trades listed in the following table.
| Dimensions | Name |
|---|---|
| t, r, m, e | primary |
| t, r, m, e | intermediate |
| t, r, m, e | manufactured |
| t, r, m, e, g | final |
| t, r, m, e, g | waste |
Parameters
The following table presents all exogenous parameters in the plastics MFA with their respective dimensions and the sources of the respective input data. The parameters chemical_recycling_rate, bio_production_rate, daccu_production_rate and emission_capture_rate are assumed to be historically 0 and their interpolation to future target rates can be adjusted via the scenario configuration.
| Dimensions | Name | Description | Sources |
|---|---|---|---|
| h, r | collection_rate | Collection rate of plastic waste | (Jiang et al., 2020)1, (Yonggang et al., 2024)2, (Hunan Yinghong New Materials Co., Ltd., 2020)3, (OECD, 2022)4, (Plastics Europe, 2025)5, (US EPA, 2017)6 |
| h, r | mechanical_recycling_rate | Mechanical recycling rate of collected waste | (Jiang et al., 2020)1, (Yonggang et al., 2024)2, (Hunan Yinghong New Materials Co., Ltd., 2020)3, (OECD, 2022)4, (Plastics Europe, 2025)5, (US EPA, 2017)6 |
| h, r | chemical_recycling_rate | Chemical recycling rate of collected waste | |
| h, r | incineration_rate | Incineration rate of collected waste | (Jiang et al., 2020)1, (Yonggang et al., 2024)2, (Hunan Yinghong New Materials Co., Ltd., 2020)3, (OECD, 2022)4, (Plastics Europe, 2025)5, (US EPA, 2017)6 |
| h, r | primary_his_imports | Historic primary plastics imports | (Geyer et al., 2017)7, (OECD, 2022)4, (UNCTAD, n.d.)8 |
| h, r | primary_his_exports | Historic primary plastics exports | (Geyer et al., 2017)7, (OECD, 2022)4, (UNCTAD, n.d.)8 |
| h, r | intermediate_his_imports | Historic intermediate plastics imports | (Geyer et al., 2017)7, (OECD, 2022)4, (UNCTAD, n.d.)8 |
| h, r | intermediate_his_exports | Historic intermediate plastics exports | (Geyer et al., 2017)7, (OECD, 2022)4, (UNCTAD, n.d.)8 |
| h, r | manufactured_his_imports | Historic manufactured plastics imports | (Geyer et al., 2017)7, (OECD, 2022)4, (UNCTAD, n.d.)8 |
| h, r | manufactured_his_exports | Historic manufactured plastics exports | (Geyer et al., 2017)7, (OECD, 2022)4, (UNCTAD, n.d.)8 |
| h, r | final_his_imports | Historic final goods imports | (Geyer et al., 2017)7, (OECD, 2022)4, (UNCTAD, n.d.)8 |
| h, r | final_his_exports | Historic final goods exports | (Geyer et al., 2017)7, (OECD, 2022)4, (UNCTAD, n.d.)8 |
| t, r | waste_imports | Plastic waste imports (historic and future assumption) | (Geyer et al., 2017)7, (OECD, 2022)4, (UNCTAD, n.d.)8 |
| t, r | waste_exports | Plastic waste exports (historic and future assumption) | (Geyer et al., 2017)7, (OECD, 2022)4, (UNCTAD, n.d.)8 |
| h, r | bio_production_rate | Share of bio-based plastics in virgin production | |
| h, r | daccu_production_rate | Share of DACCU plastics in virgin production | |
| t, r, m | mechanical_recycling_yield | Yield of mechanical recycling | (Uekert et al., 2023)9 |
| t, r, m | reclmech_loss_uncontrolled_rate | Rate of mechanical recycling losses to uncontrolled disposal | (Brown et al., 2023)10 |
| r, m, g | material_shares_in_goods | Share of materials in goods | (OECD, 2022)4 |
| h, r | emission_capture_rate | Carbon capture rate for emissions of incinerated plastics | |
| e, m | carbon_content_materials | Carbon content of materials | Data from stochiometric calculations and estimates based on expert judgement for broader categories |
| h, r, g | consumption | Historic consumption | (Geyer et al., 2017)7, (OECD, 2022)4 |
| g | lifetime_mean | Mean lifetime of goods | (Geyer et al., 2017)7 |
| g | lifetime_std | Standard deviation of lifetime | (Geyer et al., 2017)7 |
| t, r | population | Population | (International Monetary Fund, 2021)11, (India Department of Economic Affairs, n.d.)12, (India Ministry of Health, 2019)13, (IIASA, 2024)14, (James et al., 2012)15, (Arujo et al., 2021)16, (World Bank, 2023a)17, (IIASA, 2024)14, (Crespo Cuaresma, 2017)18, (Dellink et al., 2017)19, (KC et al., 2024)20, (United Nations, Department on Economic and Social Affairs, Population Division, 2022)21, (World Bank, 2023b)22, (Gapminder, n.d.)23, (James et al., 2012)15, (Bolt et al., 2014)24 |
| t, r | gdppc | GDP per capita | (International Monetary Fund, 2021)11, (India Department of Economic Affairs, n.d.)12, (India Ministry of Health, 2019)13, (IIASA, 2024)14, (James et al., 2012)15, (Arujo et al., 2021)16, (World Bank, 2023a)17, (IIASA, 2024)14, (Crespo Cuaresma, 2017)18, (Dellink et al., 2017)19, (KC et al., 2024)20, (United Nations, Department on Economic and Social Affairs, Population Division, 2022)21, (World Bank, 2023b)22, (Gapminder, n.d.)23, (Bolt et al., 2014)24, (James et al., 2012)15, (Bolt et al., 2014)24 |
-
Jiang, X., Wang, T., Jiang, M., Xu, M., Yu, Y., Guo, B., Chen, D., Hu, S., Jiang, J., Zhang, Y., & Zhu, B. (2020). Assessment of Plastic Stocks and Flows in China: 1978-2017. Resources, Conservation and Recycling, 161, 104969. https://doi.org/10.1016/j.resconrec.2020.104969 ↩↩↩
-
Yonggang, W., Juan, M., Yao, N., Yang, G., & Yan, C. (2024). Plastic Production, Consumption, Discarding, and Recycling Across China and Across the World. All-China Environment Federation (ACEF), Green Recycled Plastic Supply Chain Joint Working Group (GRPG). http://www.gefsgp.cn/detail.php?id=717\&fid=13\&cid=3 ↩↩↩
-
Hunan Yinghong New Materials Co., Ltd. (2020). 权威发布:2019年中国废塑料回收量1890万吨 回收率30\ . http://www.hnyhgf.com/news/20200407155356431.html ↩↩↩
-
OECD. (2022). Global Plastics Outlook: Economic Drivers, Environmental Impacts and Policy Options. OECD. https://doi.org/10.1787/de747aef-en ↩↩↩↩↩↩↩↩↩↩↩↩↩↩↩
-
Plastics Europe. (2025). Knowledge hub • Plastics Europe. In Plastics Europe. https://plasticseurope.org/knowledge-hub/ ↩↩↩
-
US EPA, O. (2017). Plastics: Material-Specific Data [Collections and {Lists}]. https://www.epa.gov/facts-and-figures-about-materials-waste-and-recycling/plastics-material-specific-data ↩↩↩
-
Geyer, R., Jambeck, J. R., & Law, K. L. (2017). Production, use, and fate of all plastics ever made. Science Advances, 3(7), e1700782. https://doi.org/10.1126/sciadv.1700782 ↩↩↩↩↩↩↩↩↩↩↩↩↩
-
UNCTAD. (n.d.). Plastics trade by partner, annual (analytical). In UNCTADstat Data Centre. Retrieved October 23, 2025, from https://unctadstat.unctad.org/datacentre/reportInfo/US.PlasticsTradebyPartner ↩↩↩↩↩↩↩↩↩↩
-
Uekert, T., Singh, A., DesVeaux, J. S., Ghosh, T., Bhatt, A., Yadav, G., Afzal, S., Walzberg, J., Knauer, K. M., Nicholson, S. R., Beckham, G. T., & Carpenter, A. C. (2023). Technical, economic, and environmental comparison of closed-loop recycling technologies for common plastics. ACS Sustainable Chemistry & Engineering, 11(3), 965--978. https://doi.org/10.1021/acssuschemeng.2c05497 ↩
-
Brown, E., MacDonald, A., Allen, S., & Allen, D. (2023). The potential for a plastic recycling facility to release microplastic pollution and possible filtration remediation effectiveness. Journal of Hazardous Materials Advances, 10, 100309. https://doi.org/10.1016/j.hazadv.2023.100309 ↩
-
International Monetary Fund. (2021). World Economic Outlook database of the IMF. https://www.imf.org/-/media/Files/Publications/WEO/WEO-Database/2021/WEOOct2021all.ashx ↩↩
-
India Department of Economic Affairs. (n.d.). Department of Economic Affairs (DEA) projections FY 2024-25 to FY 2047-48. ↩↩
-
India Ministry of Health. (2019). PopulationProjections for India and States 2011 -- 2036. https://nhm.gov.in/New\_Updates\_2018/Report\_Population\_Projection\_2019.pdf ↩↩
-
IIASA. (2024). Socioeconomic Projections of the Shared Socioeconomic Pathways (SSPs), hosted by IIASA. SSP Scenario Explorer hosted by IIASA. https://data.ece.iiasa.ac.at/ssp ↩↩↩↩
-
James, S. L., Gubbins, P., Murray, C. J., & Gakidou, E. (2012). Developing a comprehensive time series of GDP per capita for 210 countries from 1950 to 2015. Population Health Metrics, 10(1), 12. https://doi.org/10.1186/1478-7954-10-12 ↩↩↩↩
-
Arujo, E., Bodirsky, B. L., Crawford, M. S., Leip, D., & Dietrich, J. (2021). MissingIslands dataset for filling in data gaps from the WDI datasets. Zenodo. https://doi.org/10.5281/ZENODO.4421504 ↩↩
-
World Bank. (2023a). Population Estimates and Projections by the World Bank 1960-2050. ↩↩
-
Crespo Cuaresma, J. (2017). Income projections for climate change research: A framework based on human capital dynamics. Global Environmental Change, 42, 226--236. https://doi.org/10.1016/j.gloenvcha.2015.02.012 ↩↩
-
Dellink, R., Chateau, J., Lanzi, E., & Magné, B. (2017). Long-term economic growth projections in the Shared Socioeconomic Pathways. Global Environmental Change, 42, 200--214. https://doi.org/10.1016/j.gloenvcha.2015.06.004 ↩↩
-
KC, S., Moradhvaj, Potancokova, M., Adhikari, S., Yildiz, D., Mamolo, M., Sobotka, T., Zeman, K., Abel, G., Lutz, W., & Goujon, A. (2024). Wittgenstein Center (WIC) Population and Human Capital Projections - 2023. Zenodo. https://doi.org/10.5281/ZENODO.7767425 ↩↩
-
World Bank. (2023b). Select indicators from the World Development Indicators database from the World Bank. ↩↩
-
Gapminder. (n.d.). Population. Retrieved December 16, 2025, from https://www.gapminder.org/data/documentation/gd003/ ↩↩
-
Bolt, J., Timmer, M., & Van Zanden, J. L. (2014). GDP per capita since 1820. In How was life?: Global well-being since 1820. OECD. https://doi.org/10.1787/9789264214262-en ↩↩↩